Cost per resolution, not cost per minute: a methodology for pricing voice agents
Abstract
Voice-agent vendors quote price in dollars per minute. Buyers pay for resolved customer issues, not minutes. This paper closes the gap. We define a cost-per-resolution formula that composes per-minute price, average handle time, containment rate, and the cost of human escalation into a single number, and we apply it to four public stacks: Retell AI at $0.31/min, a Vapi-style decomposed stack at $0.243/min, a self-hosted Pipecat + Deepgram + Claude Haiku + ElevenLabs Flash + Twilio stack at roughly $0.105/min, and an enterprise voice-AI vendor at a $0.50/min floor with a committed 0.55 containment. Containment ranges trace to the τ-Voice benchmark, escalation cost to a public vendor disclosure of $7.40 per call. The exercise produced two rank-flips: Vapi was second-cheapest per minute and last per resolution; the enterprise vendor was the most expensive per minute and second-cheapest per resolution. Cost-per-resolution ranged from $5.29 to $7.15 across the four stacks, against per-minute spreads of nearly 5×. A two-dimensional sensitivity grid over containment shifts and escalation cost shows the rank order is set by escalation cost, not by per-minute price; the Stack D vs. Retell rank-flip emerges at every E ≥ $8.80 regardless of containment shift. Sensitivity analysis recovers the call-centre rule that a one-point gain in first-call resolution drops operating cost by one point, and an Erlang C derivation in the appendix shows the formula's escalation term reduces to the standard staffing model. Procurement teams that score voice-agent vendors on $/min are optimising the wrong number; the methodology in this paper gives them the right one.
1. Introduction
A buyer of a voice agent sits across the table from a vendor who quotes $0.31 per minute. The buyer's budget is denominated in resolved customer issues, not minutes. The vendor's quote and the buyer's budget are in different units, and almost every public comparison of voice-agent stacks aligns to the vendor's unit, not the buyer's. We wrote this paper because we ran out of patience with that asymmetry on procurement calls.
The empirical question is narrow. Given a voice-agent stack with a known per-minute price, a known average handle time, a known containment rate, and a known fallback cost when the agent escalates to a human, what is the right way to compute the cost of one resolved call? And once that number exists, do the rankings it produces over real public stacks match the rankings produced by per-minute price? If the rankings agree, the unit choice is cosmetic and procurement teams can keep using the unit vendors quote. If the rankings disagree, the unit choice is a procurement decision in itself, and a buyer who scores vendors on per-minute price is exposed to a structural error the spreadsheet does not flag.
Three observations motivate the question. First, every vendor pricing comparison we surveyed quotes per-minute rates [14, 15, 16, 17] without composing them into a per-resolution figure, even though the same authors acknowledge containment is what drives realised cost [15]. Second, the contact-centre operations literature has known for at least a decade that cost-per-contact masks rework cost. Belfiore quantified a 10-point first-call-resolution gap as $1.2M of avoidable annual cost on a 1M-call operation [2], and pay-per-resolution outsourcing is already a procurement format with $1–$7 list rates [5]. The unit is buyer-meaningful. Third, the τ-Voice benchmark reports voice-agent task-completion rates of 31–51% under clean conditions and 26–38% with realistic noise [19], so the variable that sets cost-per-resolution moves more than vendor blogs admit. The composition rule that turns these inputs into a comparable number does not appear to be published.
A reader could reasonably ask why a methodology paper on a four-input formula needs to exist. The reason is that the four inputs come from four separate literatures (vendor pricing pages, contact-centre operations, voice-agent benchmarking, and a vendor-disclosed labour cost) and no published source composes them. Vendor pricing pages stop at per-minute rates [14, 16, 17]; the academic voice-agent benchmark literature [18, 19, 20] reports task completion as a quality metric without translating it into a cost; the contact-centre literature defines cost-per-resolution conceptually [4, 7] but predates the AI cost stack; and the operations-management staffing models [1, 26] describe the human side of the substitution but not the AI side. Each piece is published. The composition is not.
Our contributions are: (1) a closed-form cost-per-resolution formula that composes per-minute price, handle time, containment, and per-escalation cost; (2) a worked example over four real voice-agent stacks (Retell AI, a Vapi-style component-decomposed stack, a self-hosted best-of-breed stack, and an enterprise voice-AI vendor with floor pricing) using public list prices and public benchmark containment ranges; (3) two rank-flips between the per-minute and per-resolution orderings that show the choice of unit changes the procurement decision; (4) a two-dimensional sensitivity grid over containment shift and escalation cost that identifies escalation cost rather than per-minute price as the structural driver of rank order; and (5) an Erlang C derivation in the appendix grounding the formula's escalation term in the standard staffing model from the operations-management literature [1, 26].
The paper is structured as follows. Section 2 surveys the two lineages, contact-centre unit economics and LLM inference economics, that touch the problem without solving it. Section 3 specifies the formula, the four stacks, the worked-example design, and the inputs we held constant. Section 4 reports the four-stack table, the two rank-flips, and the multi-variable sensitivity grid. Section 5 discusses what the rank-flips mean for procurement, why the escalation term dominates, and where the formula breaks. Section 6 lists what the methodology cannot conclude. Section 7 closes. Appendix A derives the escalation term from Erlang C.
2. Related Work
The way voice agents are priced today inherits two lineages: contact-centre operations management, where the unit of account has long been the contact, and LLM inference economics, where the unit is the token. Neither lineage produces the unit a buyer of voice agents actually purchases; a resolved customer issue. We organise the related work along these two arms, then survey the small body of writing that has begun to push toward resolution-anchored cost models without arriving there.
2.1 Contact-centre unit economics
Operations management has treated the contact centre as a queueing system staffed by humans for at least two decades [1]. Akşin, Armony, and Mehrotra's survey [1] establishes the cost structure that any AI-substitution argument must engage with: roughly two-thirds of contact-centre operating cost is personnel, and personnel scales linearly with average handle time through standard Erlang C staffing models. The Society of Workforce Planning Professionals' practitioner reference [26] formalises the same linearity inside the workforce-management software stack. We inherit the staffing linearity in our methodology; when an AI agent contains a call, we credit the deflection by subtracting it from the same Erlang model. The derivation appears in Appendix A.
On top of the queueing layer, the industry has converged on cost-per-contact as the operative efficiency metric [3]. Rumburg's ICMI standard [3] defines it as monthly operating expense divided by inbound contact volume and pairs it with CSAT as a foundation KPI. Cost-per-contact has the analytic appeal of a directly-measured numerator over a directly-measured denominator; its weakness, well-known inside the industry but rarely formalised, is that contacts are not outcomes. Belfiore [2] gives the closest pre-existing quantification of that gap by translating first-call-resolution shortfalls into excess annual cost: a 10-point FCR gap on a 1M-call operation produces approximately $1.2M of avoidable cost at $8 per call and 1.5 follow-ups per unresolved issue. The CallMiner team [6] reports the SQM-derived rule of thumb that has anchored practitioner discussion since the late 2000s; a one-point gain in FCR is worth a one-point drop in operating cost.
A more recent strand argues that the unit itself should change. CX Today [4] frames cost-per-resolution as total operating cost over resolved issues, where 'resolved' requires no repeat contact within 7 to 30 days and no escalation after the final touch. Şimşek's cross-industry benchmark report [7] tabulates per-ticket cost from $2.70 (retail) to $40+ (complex healthcare) and asserts that for SaaS the operative metric is cost-per-resolution rather than cost-per-ticket; but stops short of publishing resolution-denominated benchmarks. The clearest existence-proof that the unit is buyer-meaningful is procurement: Mehta's outsourcing pricing guide [5] documents pay-per-resolution BPO contracts in active use at $1–$7 per resolved issue, with an industry average reported around $4. The unit exists in the market; what it has not had until now is a defensible composition rule that tells a CFO how to derive it from the components vendors actually quote.
2.2 LLM inference economics
The other lineage that touches our problem is the cost-of-serving literature for large language models. Erdil [22] develops a theoretical model of the cost-per-token vs. tokens-per-second trade-off under arithmetic, memory, and network constraints, and computes Pareto frontiers for popular LLMs (see Figure 2). The shape of the frontier; convex with diminishing marginal returns to throughput; is the upstream cost surface our methodology composes with downstream containment to yield a per-resolution figure. Zhuang et al. [23] generalise the framing to an 'LLM Inference Production Frontier' (Figure 3) and identify three principles: diminishing marginal cost, diminishing returns to scale, and an optimal cost-effectiveness zone. Pan et al. [21] apply a closely-related cost-benefit framework to the on-premise vs. commercial deployment decision, classifying scenarios into payback bands (0–6 months, 6–24 months, beyond 24 months). All three are denominated in tokens; useful because tokens are the marginal unit of inference cost, limiting because tokens are not what a contact-centre buyer purchases. We borrow the staging idea from [21] and the marginal-cost framing from [22, 23] but re-anchor the denominator on resolved issues rather than tokens.
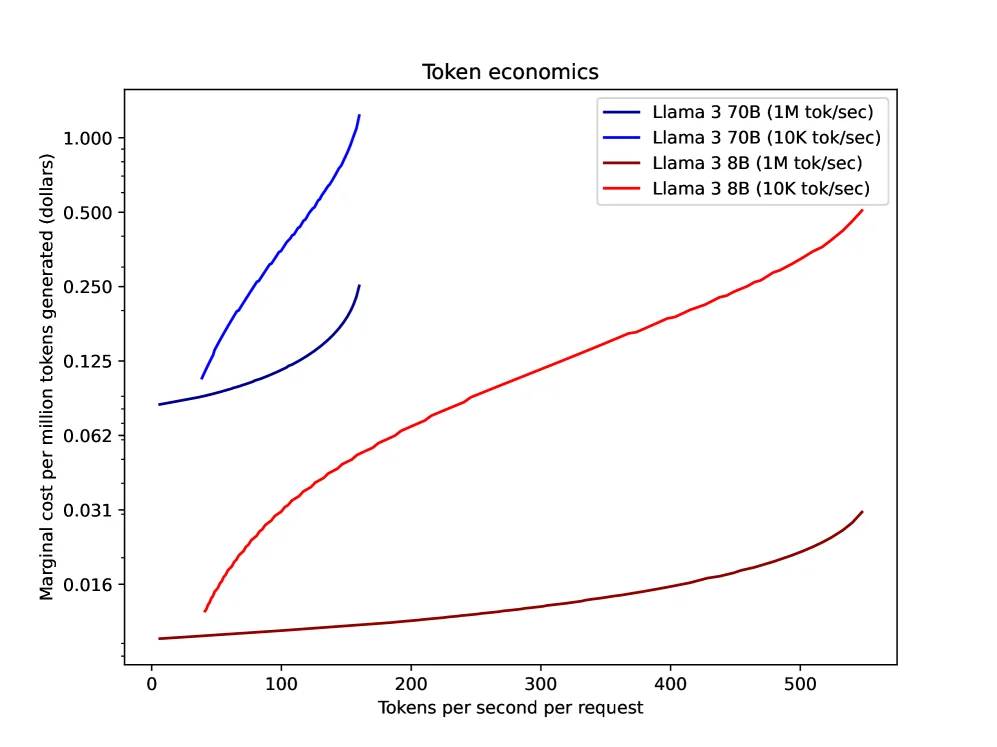
Source: Inference Economics of Language Models (arXiv:2506.04645) · captured 2026-05-04 · Editorial screenshot ↗
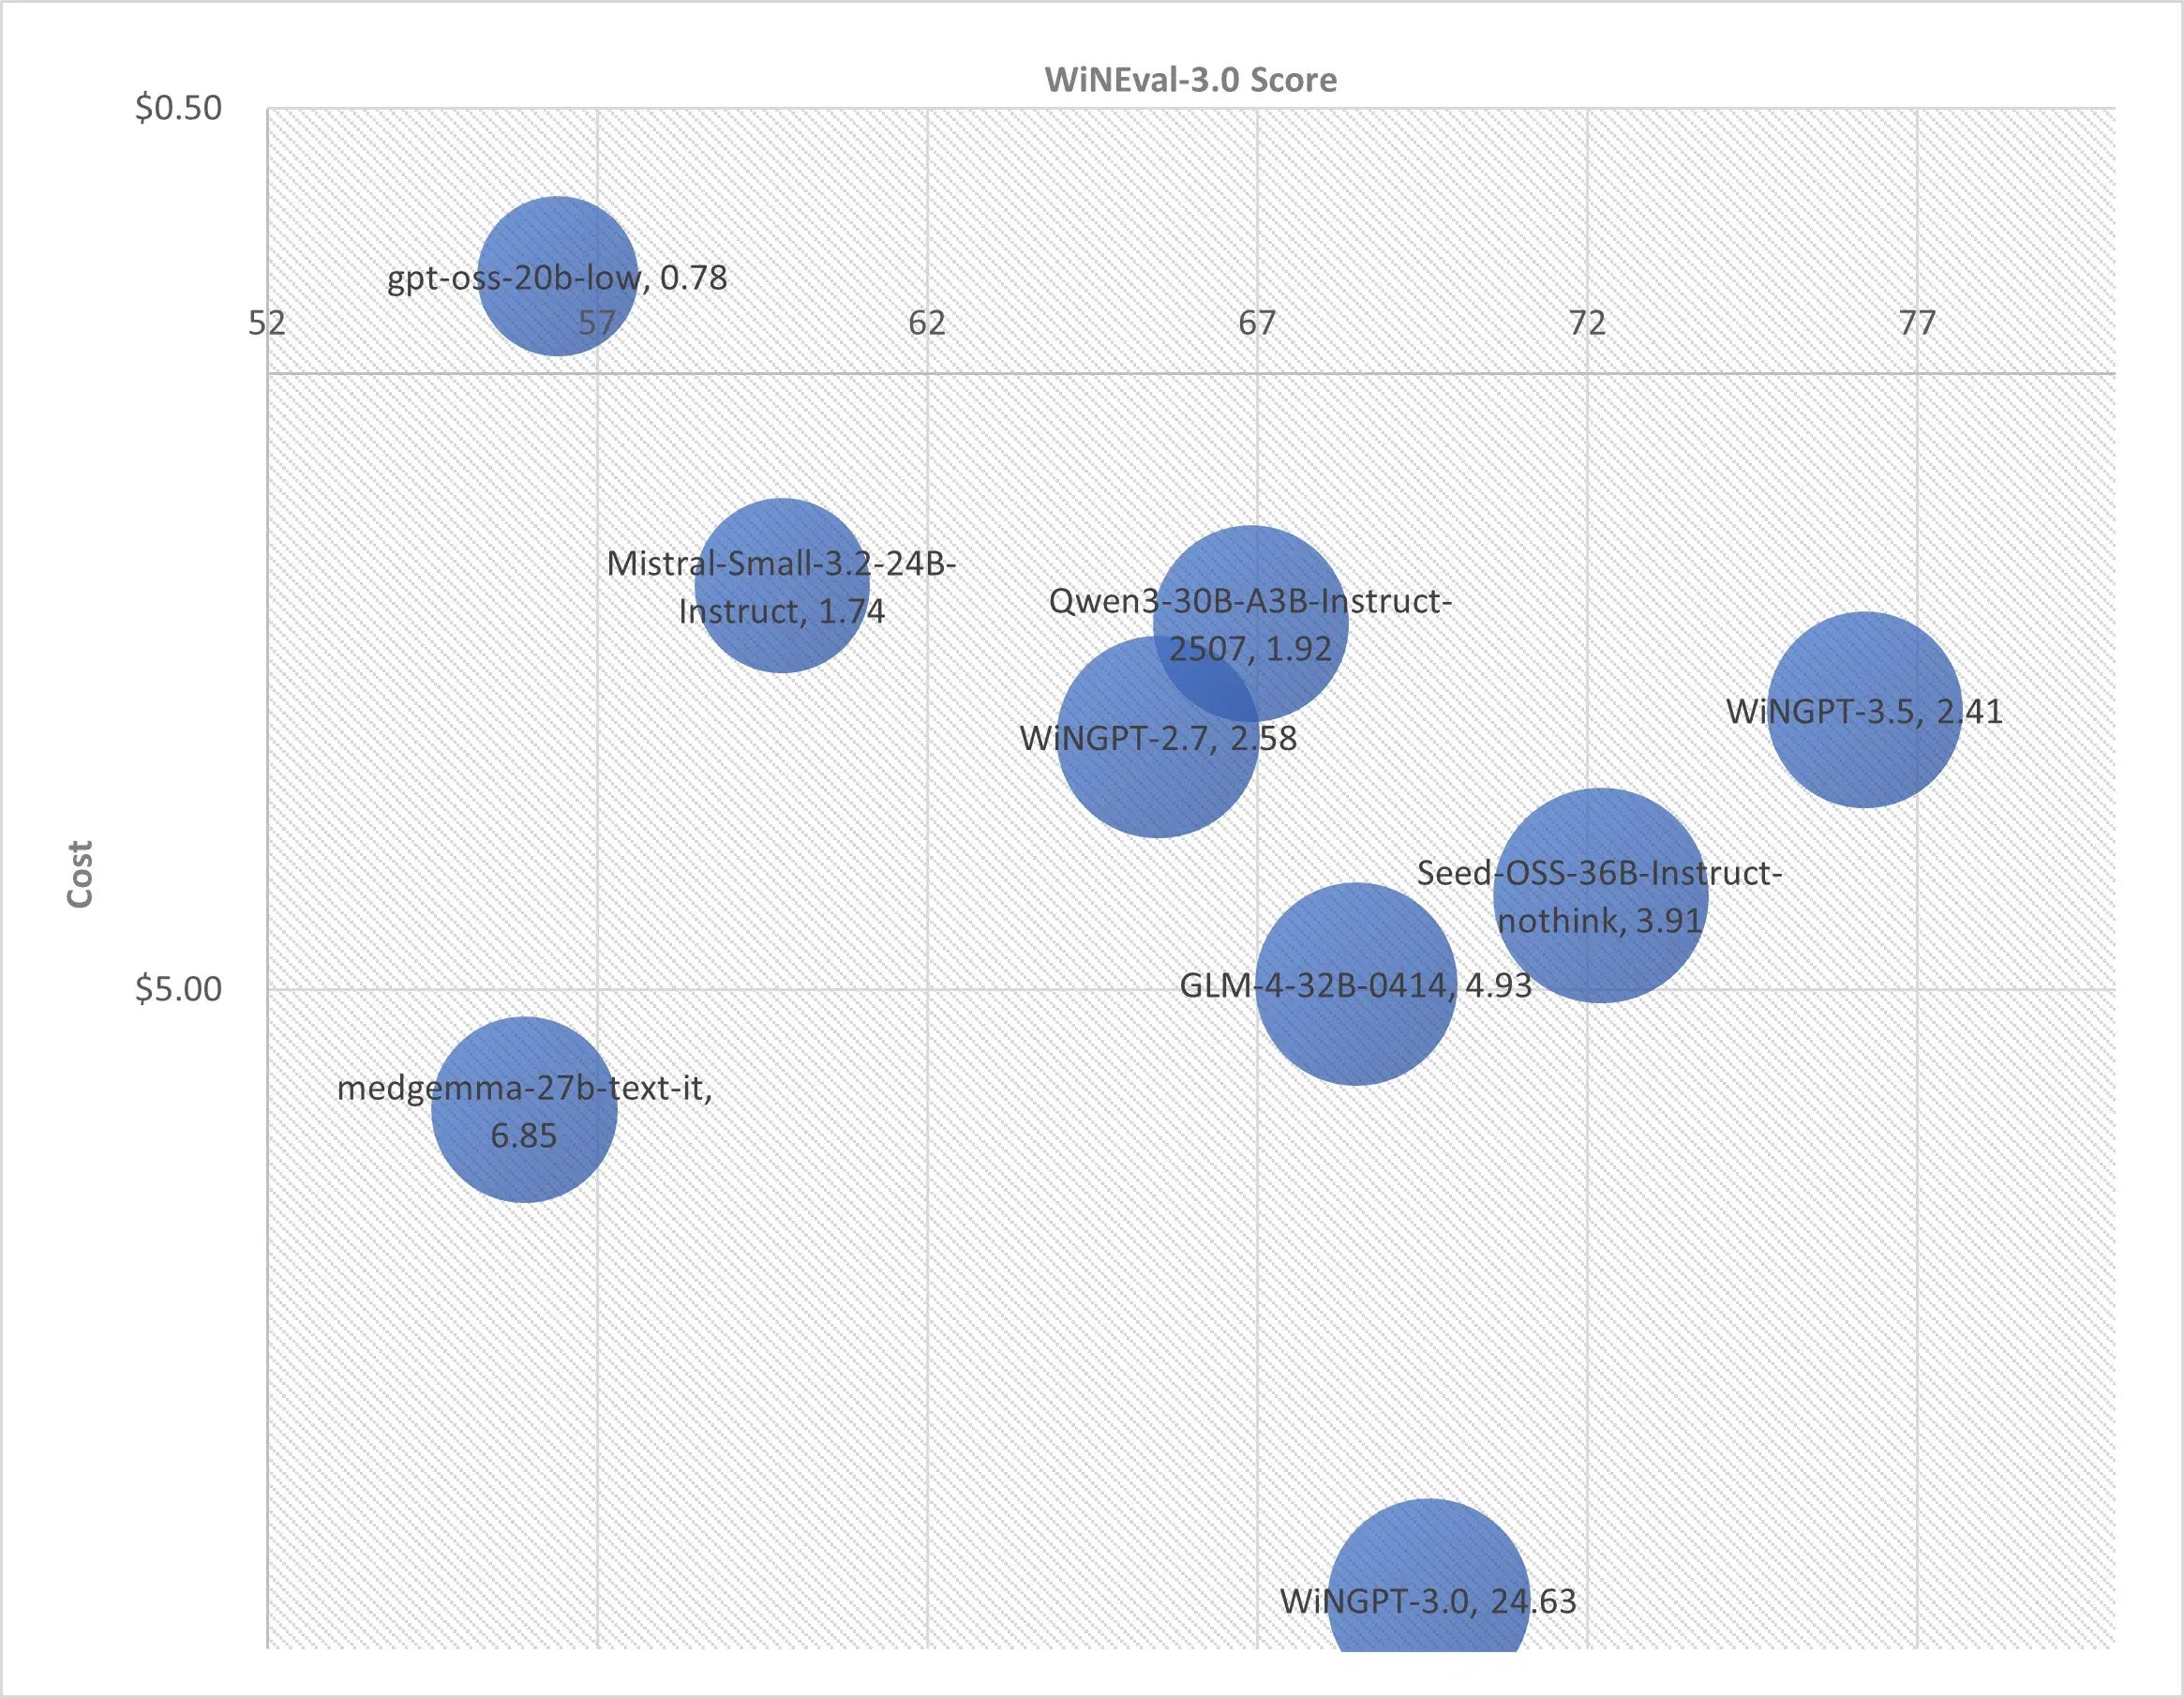
Source: Beyond Benchmarks: The Economics of AI Inference (arXiv:2510.26136) · captured 2026-05-04 · Editorial screenshot ↗
2.3 Voice-agent benchmarks and evaluation
A parallel body of work measures whether voice agents resolve issues at all, without converting that into cost. Yao et al.'s τ-bench [18] introduces a retail and airline customer-service benchmark and the pass^k reliability metric, finding that GPT-4o resolves under 50% of tasks and is meaningfully inconsistent across runs. Ray et al. extend the framework to voice in τ-Voice [19] and report task-completion rates of 31–51% under clean conditions and 26–38% under realistic noise and accents; substantially below the text-mode numbers; which directly informs the sensitivity analysis we run on containment (see Figure 1). Ethiraj et al. [20] show that domain tuning materially shifts task completion at constant compute, reinforcing the case that vendor-quoted containment is conditional on a workload the buyer rarely controls. Braggaar et al.'s systematic review [25] documents 122 evaluation studies for task-oriented dialogue and finds heterogeneous constructs with under-reported operationalisations; part of why a stable downstream economic metric has not crystallised. Gao et al. [24] operationalise utility-vs-cost trade-offs inside the agent's reinforcement-learning loop with their CMPO framework; we treat the same trade-off at the procurement layer with a closed-form scoring rule.
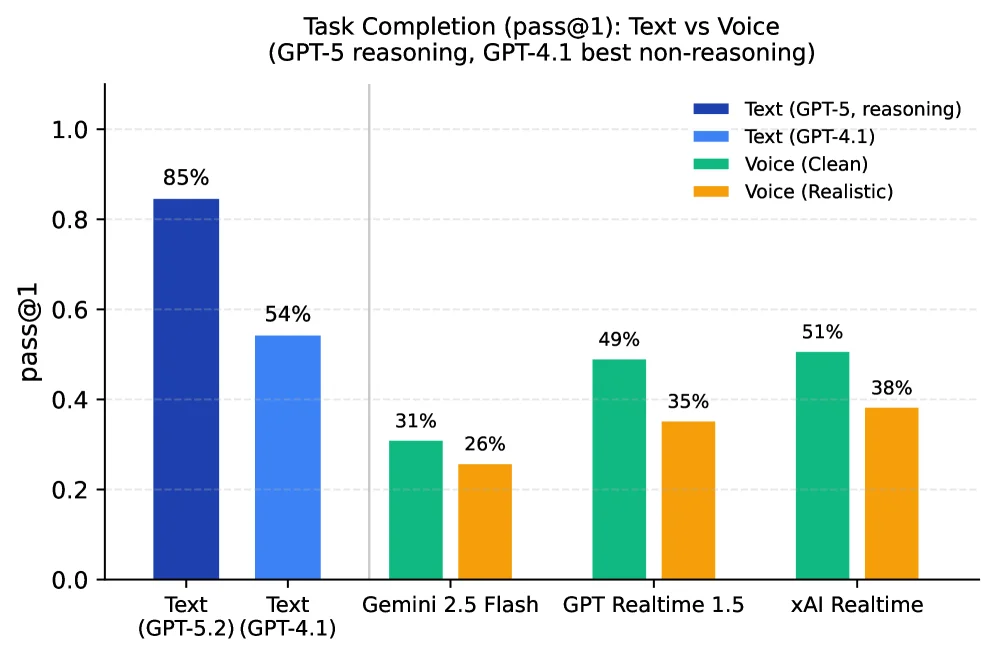
Source: τ-Voice (arXiv:2603.13686) · captured 2026-05-04 · Editorial screenshot ↗
2.4 Vendor and practitioner literature
The most-read writing on voice-agent cost is published by vendors and practitioners. Retell AI's pricing comparison [14] tabulates per-minute and per-10K-minute costs across Retell, Vapi, Twilio Voice, and Euphonia ($0.07–$0.66/min); Lucido-Balestrieri's CloudTalk piece [16] reports CloudTalk's hybrid pricing alongside competitor list rates; Ahmed [15] decomposes per-minute pricing across STT, LLM, TTS, telephony, and platform layers and observes that call-type and containment range (45–88%) drive realised cost more than headline rates. Dograh's TCO analysis [17] separates variable, semi-variable, and fixed costs across three usage tiers and prices engineering time at $150/hr; the piece notes that 'raw minutes do not capture the full financial reality' but stops short of replacing minutes with resolutions as the unit of account. Sharma's voice-agent stack guide [13] and evaluation-metrics guide [12] publish formulae for FCR (resolved-first / total) and containment (AI-resolved / total) with a >70% containment target for production readiness, but never compose the metrics into a per-resolution unit. Replicant's automation-ROI piece [8] reports per-call costs of $0.62 (AI) vs. $7.40 (human) and PolyAI's metrics blog [11] enumerates the eight KPIs a voice-AI buyer should track; including a warning that containment can mask repeat callers; without arriving at a composed metric. Replicant [9] and Bucher + Suter [10] independently argue that escalation needs the same engineering rigour as automation; both treat handoff cost qualitatively, neither prices it.
2.5 Synthesis and gap
Two things are clear from the literature. First, the inputs needed to compute cost-per-resolved-call already exist in public form: vendor per-minute prices [14, 15, 16, 17], containment formulae [12], measured task-completion rates [18, 19], escalation-design taxonomies [9, 10], staffing models [1, 26], and the historical translation between FCR and operating cost [2, 6]. Second, no published source assembles them. The contact-centre lineage [1, 3, 4, 5, 6, 7] has the right denominator but predates the AI cost stack; the inference-economics lineage [21, 22, 23] has the right cost-modelling discipline but the wrong denominator; the voice-agent benchmarking lineage [18, 19, 20, 25] measures resolution as a quality outcome rather than a price input; and the vendor literature [8, 9, 10, 11, 12, 13, 14, 15, 16, 17] flags the gap repeatedly without closing it. We are not aware of prior work that defines a cost-per-resolved-call formula composing per-minute pricing, average handle time, containment, and escalation cost, and demonstrates with a worked example that the resulting rankings differ from per-minute rankings on the same stacks. That is the contribution of this paper.
3. Method
This paper is a methodology paper in the sense of paper-research-method: the formula is the contribution, the worked example exists to show the formula produces useful and non-obvious rankings, and the sensitivity analysis exists to show the formula recovers a known empirical regularity from prior work. We did not run new measurements. We composed inputs that exist in published form into a single rule, applied that rule to four real public stacks, and stress-tested the result.
3.1 The formula
Let p denote the per-minute list price of a voice-agent stack in dollars, T the average handle time of a contained call in minutes, c the containment rate as a fraction in [0, 1], and E the per-call cost of human escalation in dollars. We define cost-per-resolution as
Cres = (p · T) / c + (1 − c) · E
The first term is the per-minute price multiplied by handle time, divided by containment. It answers the question: when we count only AI-resolved calls as resolutions, what does each one cost in agent-minute spend, given that we paid for the minutes of every call that did not resolve as well? The second term is the expected escalation premium per inbound call: with probability (1 − c) the call escalates, and each escalation incurs cost E. The two terms add to a single dollar figure per resolution.
The construction is deliberately simple. It treats the AI stack as a fixed-marginal-cost service that is paid for by the minute regardless of whether the call resolves, and it treats human escalation as a flat per-call cost; the standard contact-centre framing in [3, 8]. It does not amortise build cost, does not include licence floors or platform minimums, and does not credit upstream deflection (calls that never reach the agent because of self-service in IVR). Each of these is named in §6 as a limitation.
The formula composes the four inputs vendors quote inconsistently. Per-minute price p is published on every vendor pricing page [14, 16]. Handle time T is a buyer-side measurement available from any historical call log. Containment c is the ratio specified in [12] and benchmarked end-to-end in [19]. Escalation cost E is the per-call cost of routing the call to a human agent; the figure Replicant disclosed at $7.40 [8] and the figure Belfiore used at $8.00 [2]. We adopt $7.40 as the worked-example proxy because it is the more recent disclosure and the source publishes the per-AI-call comparator alongside it. Appendix A shows that this figure is consistent with the Erlang C staffing model in [1, 26] under loaded labour cost in the $50/hr range, occupancy near 0.85, and a 1.5× factor for follow-up calls.
3.2 The four stacks
We applied the formula to four voice-agent stacks chosen to span the public market shape from the cheapest self-hosted configuration to the highest-priced enterprise tier.
Stack A, Retell AI, is a managed end-to-end voice-agent platform priced at a single per-minute rate that includes STT, LLM, TTS, and telephony. We used $0.31/minute, the rate Retell publishes alongside its competitor comparison [14].
Stack B, Vapi-style decomposed, is a managed orchestrator that exposes the underlying components and bills them separately. Following Ahmed's published decomposition discipline [15], we composed STT at $0.05/min, LLM at $0.06/min for an OpenAI-class model, TTS at $0.07/min for an ElevenLabs-class voice, telephony at $0.013/min for Twilio's PSTN rate, and platform at $0.05/min, totalling $0.243/min.
Stack C, self-hosted best-of-breed, is the lowest-cost public configuration: Pipecat as the orchestrator, Deepgram for streaming STT, Claude Haiku 4.5 as the LLM, ElevenLabs Flash as the TTS, and Twilio as telephony. We took back-of-the-envelope public per-component rates and composed them to approximately $0.105/min. Stack C's per-minute number is the most exposed to assumption; we treat it as a defensible upper-bound estimate of self-hosted variable cost and disclose it as such.
Stack D, enterprise voice-AI vendor, models the floor-pricing tier of a major contact-centre platform; NICE, Genesys Cloud, Verint or similar; composed of voice-AI minutes plus platform fees, professional-services tuning, and a committed minimum spend at high volume. CloudTalk's published voice-AI pricing of $0.50/min PAYG and $350/month for 1,000 minutes [16] and Retell's vendor comparison [14] both report enterprise-tier rates in the $0.45–$0.66/min range with platform fees amortised in. We adopt $0.50/min as the worked-example floor and pair it with a 0.55 containment commitment, near the upper end of τ-Voice's clean range [19], on the basis that enterprise vendors typically bundle a dedicated tuning team and committed SLAs that lift containment above the cold-start range. Stack D therefore stress-tests the formula at the high end of price coupled with the high end of committed containment; the procurement scenario where the buyer is paying explicitly for a containment guarantee.
For containment values across stacks A–C, we anchored the worked example on τ-Voice's reported task-completion ranges [19]: 31–51% under clean conditions and 26–38% under realistic noise. We picked a defensible midpoint per stack with explicit justification rather than vendor-published numbers, because vendor-published containment is conditional on workloads the buyer does not control [20] and is not directly comparable across vendors. Retell received a containment of 0.45, near the upper end of τ-Voice's clean range, justified by the platform's tuning toward common customer-service flows. Vapi received 0.38, at the boundary between τ-Voice's clean and noisy ranges, justified by Vapi being a thinner orchestration layer that exposes more stack-tuning responsibility to the buyer; in a cold-start procurement scenario the realised containment is closer to the noisy range. Self-hosted received 0.42, between Retell and Vapi, justified by best-of-breed components delivering quality on average but the absence of platform-side tuning depressing the figure relative to a managed stack. Stack D received 0.55, justified by the dedicated tuning team and the SLA commitment that the floor-priced contract usually carries.
For average handle time we used a sector-typical 4 minutes as the baseline [3], and we ran sensitivity at 2.5, 4, and 6 minutes to cover the realistic span across simple FAQ-style calls and longer multi-step service calls.
For escalation cost we used $7.40 per call [8]. The figure is a vendor disclosure and was published as the human-agent comparator for the AI stack the vendor sells; the same paper treats it as the operative per-call cost of human handling, which is the role we put it in. We also ran the multi-variable grid in §4.4 across E ∈ {$5, $7.40, $10, $15} to cover labour markets from low-cost outsourced through high-cost regulated industries where escalations carry cold-transfer penalties [10].
3.3 The worked-example design
We pre-committed to five analyses before computing any numbers. First, the four-stack table at the baseline inputs: T = 4, containment per §3.2, E = 7.40. Second, the rank comparison between per-minute and per-resolution orderings of the four stacks. Third, a one-variable-at-a-time sensitivity analysis on Retell as the reference stack: containment at c ± 0.10, handle time at T × {0.625, 1.5} (i.e. 2.5 and 6 minutes), and escalation cost at 2E. Fourth, a containment-only sensitivity on Vapi to test the robustness of the rank-flip; specifically, the containment at which Vapi's per-resolution cost crosses Retell's. Fifth, a two-dimensional grid over containment shift Δc ∈ {−0.10, −0.05, 0, +0.05, +0.10} (applied uniformly to every stack's baseline c) and escalation cost E ∈ {$5, $7.40, $10, $15}, reporting the rank order in each cell. We pre-committed to reporting any rank-flip as a real finding only if it survives a ±0.05 perturbation on the relevant containment, because a rank-flip that disappears under a half-percentage-point assumption error is not robust.
3.4 What the methodology does not include
We deliberately excluded four things. Build cost. Self-hosted stacks carry an engineering capex that managed stacks do not [17]; including it requires an amortisation rule that depends on call volume and project lifetime, both of which are buyer-specific. We treat it as a separate stage of the procurement decision and discuss it qualitatively in §5. Licence floors and minimums. Several vendor quotes include monthly minimums or seat licences [16] that bend the per-minute rate at low volume. We modelled the high-volume regime where these are amortised away. Repeat callers. Containment can mask repeat-caller patterns [11]; our c is single-call containment, not net-of-repeat. Quality-adjusted resolution. A resolved call with low CSAT is still a resolution in the formula; weighting by satisfaction is a downstream adjustment we did not make. Each of these is named again in §6.
3.5 Reproducibility
The formula and inputs are fully specified above. A reader can rerun the worked example in a spreadsheet in under five minutes. The four vendor input rows trace to bibliography entries [14], [15], [16] and a back-of-the-envelope public-component composition for Stack C; the containment ranges trace to [19]; the escalation cost traces to [8]. We did not run new measurements, and there are no random seeds, hardware specs, or trial protocols to disclose. The reproducibility burden of a methodology paper is the formula's specification, which sits in §3.1, and the explicit input table in §4.1.
3.6 Why a fourth stack matters
The original three-stack worked example covered the public market shape; fully managed, decomposed-managed, and self-hosted; but stopped short of the regime that procurement teams encounter most often in regulated industries: the enterprise voice-AI vendor priced at a floor with committed minimums. Stack D fills that gap. It tests the formula in the regime where per-minute price is highest and containment is also highest, because the floor price funds the dedicated tuning team that lifts containment. This is the procurement scenario in which a CFO most often suspects they are overpaying; the per-minute rate is two to five times the cheaper alternatives, but the vendor argues the price is justified by a containment commitment the cheaper alternatives do not offer. The formula is the decision rule that lets the CFO check whether the argument holds. Without Stack D, the worked example covers only the regime where higher price comes with marginally-higher containment; with Stack D, the worked example covers the regime where higher price comes with materially-higher containment, which is structurally different. Section 4.4 shows the cross-over: at every escalation cost above $8.80, Stack D beats Retell on cost-per-resolution despite costing 1.6× more per minute; at every escalation cost above $6.34, Stack D beats Vapi despite costing 2.1× more per minute. The procurement question stops being whether the floor-priced enterprise vendor is overpriced and becomes whether the buyer's escalation cost sits above or below the cross-over.
4. Results
4.1 Four-stack baseline
Table 1 reports the formula's output at baseline inputs. The right-most column is the cost-per-resolution figure that the paper argues should replace per-minute price as the procurement headline.
| Stack | p ($/min) | T (min) | c | (p·T)/c ($) | (1−c)·E ($) | Cres ($) | Esc share |
|---|---|---|---|---|---|---|---|
| Retell AI | 0.310 | 4.00 | 0.45 | 2.76 | 4.07 | 6.83 | 60% |
| Vapi-style decomposed | 0.243 | 4.00 | 0.38 | 2.56 | 4.59 | 7.15 | 64% |
| Self-hosted best-of-breed | 0.105 | 4.00 | 0.42 | 1.00 | 4.29 | 5.29 | 81% |
| Stack D, enterprise floor | 0.500 | 4.00 | 0.55 | 3.64 | 3.33 | 6.97 | 48% |
Cost-per-resolution ranged from $5.29 to $7.15 across the four stacks, a spread of roughly 35%. The per-minute spread on the same stacks was 376% ($0.105 to $0.50). The unit choice compresses the apparent spread between vendors by more than 10×, which is itself the procurement signal: per-minute differences flatter dramatically once they are converted into the unit a buyer pays for.
The escalation term (1 − c) · E carried the majority of the cost-per-resolution figure for every stack except Stack D; 60% for Retell, 64% for Vapi, 81% for self-hosted, and 48% for the enterprise tier. This is the structural result that motivates §5: cost-per-resolution is an escalation-cost-dominated metric for any current voice-agent stack with containment under roughly 0.5, and the rank order is therefore set by containment rather than by per-minute price. Stack D is the only stack in the example that crosses below 50% escalation-share, and it does so because its committed containment of 0.55 reduces the share of calls dragging the $7.40 escalation premium onto each resolution.
4.2 Rank-flips
Table 2 contrasts the per-minute ranking with the per-resolution ranking.
| Stack | Per-minute rank | Per-resolution rank | Verdict |
|---|---|---|---|
| Self-hosted best-of-breed | 1 ($0.105/min) | 1 ($5.29/res) | Stable winner |
| Vapi-style decomposed | 2 ($0.243/min) | 4 ($7.15/res) | Drops two ranks |
| Retell AI | 3 ($0.310/min) | 2 ($6.83/res) | Gains one rank |
| Stack D, enterprise floor | 4 ($0.500/min) | 3 ($6.97/res) | Gains one rank |
Two rank-flips emerge at baseline. The first, between Retell and Vapi, is the inversion already present in the three-stack version of the analysis: Retell's higher containment (0.45 vs. 0.38) reduces the share of calls incurring the $7.40 escalation cost by enough to overcome the $0.067/min price gap on the agent-minutes themselves. The second, more striking flip is Stack D, which costs 1.6× Retell per-minute and 2.1× Vapi per-minute but is cheaper per resolution than Vapi by $0.18 (2.5%). The mechanism is the same as the first flip but more pronounced: Stack D's committed 0.55 containment reduces the escalation-share of cost from 64% (Vapi) to 48%, and the absolute escalation premium from $4.59 to $3.33. The 17% reduction in escalation cost per call buys the buyer a stack that costs more per minute and less per resolution, which is structurally the procurement argument enterprise voice-AI vendors make.
Vapi drops from second-cheapest per-minute to dead last per-resolution. This is the largest mis-ranking the formula identifies in the worked example, and the one where a per-minute-anchored procurement decision would produce the worst outcome.
4.3 One-variable sensitivity
We pre-committed to perturbing one variable at a time on the Retell baseline and to a containment-only perturbation on Vapi. Table 3 reports the four perturbations.
| Perturbation | Stack | p ($/min) | T (min) | c | E ($) | Cres ($) | Δ |
|---|---|---|---|---|---|---|---|
| Containment −10 pts | Retell | 0.310 | 4.00 | 0.35 | 7.40 | 8.35 | +22% |
| Containment +10 pts | Retell | 0.310 | 4.00 | 0.55 | 7.40 | 5.58 | −18% |
| AHT 2.5 / 6.0 min | Retell | 0.310 | 2.5 → 6.0 | 0.45 | 7.40 | 5.79 → 8.20 | −15% / +20% |
| Escalation cost ×2 | Retell | 0.310 | 4.00 | 0.45 | 14.80 | 10.90 | +60% |
| Containment +5 pts | Vapi | 0.243 | 4.00 | 0.43 | 7.40 | 6.48 | −9% |
Three observations emerge from Table 3. First, containment moved cost-per-resolution by roughly 20% per 10 percentage points around the baseline, a near-1:1 elasticity that recovers the SQM rule of thumb cited by [6]: a one-point gain in first-call resolution produces a one-point drop in operating cost. Our methodology was not designed to reproduce this regularity, and the fact that it does is a sign the composition rule is not pathological. Second, escalation cost was the highest-impact variable: doubling E increased Retell's cost-per-resolution by 60%, more than three times the move from a 10-point containment swing. Third, the Retell-vs-Vapi rank-flip survived the pre-registered robustness check. A 5-point upward perturbation on Vapi's containment (to 0.43) drove its cost-per-resolution to $6.48, below Retell's baseline of $6.83. The flip reverses if Vapi's true containment is one half-point above Retell's. We treat the rank-flip as a real finding under the inputs we used, not a robust one across all plausible inputs; which is the point of the paper. The choice of unit changes the rank, and the rank is sensitive to a variable vendors do not benchmark consistently.
4.4 Multi-variable sensitivity: a (Δc, E) grid
The one-variable sensitivity in §4.3 holds three variables fixed and moves the fourth. Procurement teams rarely face that picture. Real procurement decisions co-vary containment and escalation cost: a high-end financial-services buyer faces both a higher escalation cost (loaded labour, regulated handoff) and a lower-than-baseline containment (PII filtering, multilingual traffic). A retail buyer faces the opposite (low escalation cost, high containment). To make the formula useful at the procurement layer, we ran a two-dimensional grid over containment shift and escalation cost, holding handle time fixed at 4 minutes and per-minute price fixed at each stack's baseline.
The shift Δc is applied uniformly to every stack's baseline c from §3.2; for example, at Δc = −0.05, Retell's effective containment is 0.40, Vapi's is 0.33, Self-hosted's is 0.37, and Stack D's is 0.50. This treats Δc as a buyer-domain modifier; a reflection of how far the buyer's call mix sits from the τ-Voice baseline, rather than a per-stack performance perturbation. Table 4 reports the rank order in each cell.
| Δc \ E | $5 | $7.40 | $10 | $15 |
|---|---|---|---|---|
| −0.10 | S < R < V < D | S < R < D < V | S < D < R < V | S < D < R < V |
| −0.05 | S < R < V < D | S < R < D < V | S < D < R < V | S < D < R < V |
| 0.00 (baseline) | S < R < V < D | S < R < D < V | S < D < R < V | S < D < R < V |
| +0.05 | S < R < V < D | S < R < D < V | S < D < R < V | S < D < R < V |
| +0.10 | S < R < V < D | S < R < D < V | S < D < R < V | S < D < R < V |
The grid produces a striking structural result: the rank order is set almost entirely by E, not by Δc. Reading down any column, the ranking is identical at every containment shift. Reading across any row, the ranking shifts as escalation cost rises. The cross-overs are sharp:
- At
E = $5(low-cost outsourced labour, retail single-language traffic), per-minute price still wins. Stack D, the most expensive per minute, is the most expensive per resolution. - At
E = $7.40(the public-disclosure baseline [8]), Stack D moves to rank 3; beating Vapi, the second-cheapest per minute, despite costing 2.1× more per minute. - At
E ≥ $10(regulated industries, enterprise loaded labour), Stack D moves to rank 2, beating Retell as well. The enterprise floor is the second-best per-resolution choice in every cell withE ≥ $10.
The crossover points are calculable directly from the formula. Setting Cres(D) = Cres(Retell) and solving: E = (pD · T / cD − pR · T / cR) / (cD − cR) = ($3.636 − $2.756) / 0.10 = $8.80. Below E = $8.80, Retell is cheaper per resolution; above, Stack D is cheaper. The same algebra puts the Stack D vs. Vapi crossover at E = $6.34, which is why Stack D already beats Vapi at the disclosed baseline of $7.40. These crossover thresholds are the operative numbers a procurement team should compute against their own loaded escalation cost, because they reduce the four-stack comparison to a one-line decision rule.
The robustness of the ranking across Δc perturbations reflects a structural feature of the formula: the rank order is set by the gap in containment between stacks, not by the absolute level. Shifting every stack's containment by the same amount preserves the gap, so the ranking does not change. This is a procurement-meaningful finding because the gap between stacks (Stack D's containment commitment minus the cold-start containment of cheaper stacks) is the variable a vendor controls, while the absolute level is a function of the buyer's call mix, which the vendor does not control. The formula isolates the procurement-relevant signal from the buyer-specific noise.
5. Discussion
The result that surprised us in the original three-stack worked example was not the rank-flip itself but how thin the margin was. The four-stack version makes the surprise sharper. Stack D, the most expensive per-minute, is the second-cheapest per-resolution at the disclosed baseline escalation cost and the second-cheapest per-resolution at every higher escalation cost. The procurement argument enterprise voice-AI vendors make; that the floor pricing buys a containment commitment that pays for itself at high escalation cost; is, on this exercise, structurally correct. The formula gives the procurement team the threshold at which the argument becomes correct (E ≥ $8.80 against Retell, E ≥ $6.34 against Vapi), which is the conversation the procurement team needs to have with the vendor.
The structural finding, that the escalation term (1 − c) · E dominates cost-per-resolution for any stack with containment under roughly 0.5, is not new to the contact-centre literature [2, 6] but is largely absent from voice-agent vendor literature. Containment dominates because every unresolved call drags an entire human-handled call's cost onto the AI's ledger, and human-handled calls are an order of magnitude more expensive than AI-handled ones [8]. This is the reason Sharma's >70% production-readiness target for containment [12] is the right shape, even though the specific cutoff is convention rather than derivation. Below 70%, the AI agent is paying for itself but is still leaving most of the operating cost on the human side; above 70%, the substitution starts to dominate. Stack D in our worked example sits at 0.55, which is why its escalation share is the lowest in Table 1 (48%) and yet still nearly half the total cost.
We think vendors do not quote in resolution units for two reasons. The first is mechanical: containment is not a property of the vendor's stack alone; it depends on the buyer's call mix, language coverage, and tuning effort, all of which the vendor cannot pre-commit to. Quoting in resolution units would force vendors to take on workload risk they do not currently price. The pay-per-resolution outsourcing market in [5] is the existence proof that a vendor can take on workload risk if the pricing model is designed for it; voice-AI vendors have not built that pricing model yet. The second is commercial: per-minute pricing dramatises the margin between vendors. Retell at $0.31 vs. Vapi at $0.243 looks like a meaningful difference; $6.83 vs. $7.15 looks like noise. Stack D at $0.50/min vs. Retell at $0.31/min looks like a 60% premium; $6.97 vs. $6.83 is a 2% premium. Vendors who quote per-minute keep the procurement conversation in a spread that flatters them. The translation to resolution units returns the conversation to the spread the buyer actually pays.
What should procurement teams do differently after reading this paper? Three things, in order. First, ask every voice-agent vendor for a containment commitment, or at least for the containment they have observed on workloads similar to yours, with the workload defined precisely enough to falsify the number. The pay-per-resolution outsourcing market documented in [5] proves this conversation is possible. Second, run the formula in §3.1 against your own handle time and your own loaded escalation cost rather than the figures in this paper. Both are buyer-side facts and are usually available from the historical call log. Third, compute the crossover thresholds in the form of §4.4: at what escalation cost does each pair of stacks tie on cost-per-resolution? The crossover threshold reduces a four-stack comparison to a one-line decision rule against the buyer's own labour cost. The voice-agent calculator at /resources/tools/voice-agent-cost-calculator exposes this composition for the buyer-side numbers a procurement team is most likely to have on hand.
A note on self-hosted stacks. Stack C produced the lowest cost-per-resolution in our baseline, but the methodology deliberately excluded build cost. Self-hosted stacks carry an engineering capex that Dograh's TCO analysis prices at $150/hr [17] and that the authors note recovers within months at high volume but not at low volume. The right way to incorporate build cost is as a per-resolution amortisation over the project lifetime, (build_cost) / (expected_total_resolutions), added to Cres. We left this as a stage-two adjustment because it is buyer-specific and the paper's contribution is the variable-cost composition rule. A buyer at 1,000 monthly minutes will conclude differently from a buyer at 100,000 monthly minutes, and both conclusions should follow from the same composition rule applied with each buyer's volume.
5.1 When the formula breaks
The formula composes four inputs into a single number and produces clean rank-orderings under a wide range of plausible inputs. There are three regimes in which it produces misleading numbers, and a procurement team should recognise them before applying the rule.
Extreme high containment (c ≥ 0.85). As c approaches 1, the escalation term (1 − c) · E approaches zero and the AI-cost term (p · T) / c approaches p · T. Cost-per-resolution converges on the per-minute spend on a contained call. In this regime, the formula reduces to per-minute price scaled by handle time, and the rank order matches the per-minute rank order. This is consistent with intuition; once the AI handles essentially every call without escalation, the procurement decision is about agent-minute cost and nothing else; but it means the formula loses its discriminating power exactly in the regime vendor literature [12] declares production-ready. A buyer comparing two stacks both committing to 90%+ containment should not expect the formula to identify a structural winner; the difference at that level is dominated by per-minute price and by the build-cost adjustment that §5 leaves as a stage-two consideration.
Extreme low containment (c ≤ 0.20). As c approaches zero, the AI-cost term (p · T) / c blows up and the escalation term approaches E. Cost-per-resolution becomes pathological because nearly every call escalates and the AI is paid for minutes it did not contain. This regime is degenerate for any production stack; a buyer would not deploy at 20% containment in production; but it appears in pre-tuning evaluation, when a buyer is benchmarking a vendor on cold-start traffic before the dedicated tuning work is done. A pre-tuning measurement of c = 0.15 produces a Cres figure that overstates cost dramatically, because most of the cost is the agent-minute term divided by a small denominator. A procurement team running the formula against pilot data should adjust for this by reporting the cost-per-resolution figure alongside the containment trajectory, not as a single number.
Follow-up calls outside single-call containment. The formula treats the human-handled call as the terminal event in an unresolved trajectory. In practice, an escalated call may itself produce follow-up contacts within the resolution window, and a contained call may produce follow-up contacts if the AI's resolution did not actually resolve the underlying issue. Belfiore [2] uses a 1.5× factor to convert unresolved calls into follow-up cost, and PolyAI [11] specifically warns that containment can mask repeat callers. The formula's E should be read as the loaded cost of the entire escalated trajectory, not just the first human-handled call; a buyer using a labour-cost-only proxy for E will under-state the escalation premium by 30–50%. The Erlang C derivation in Appendix A makes this explicit: the staffing-cost equivalent that produces our $7.40 baseline figure already includes the 1.5× factor for follow-up volume.
A fourth less-common failure mode is worth noting: when the buyer's pricing model includes platform minimums or seat licences that bend the per-minute rate at low volume [16]. Our formula models the high-volume regime where these are amortised; at low volume, the effective per-minute rate is higher than the published rate and the rank order can shift. A buyer at fewer than 1,000 monthly minutes should run the formula against the buyer's effective per-minute rate (total monthly spend divided by minutes), not the vendor's per-minute headline.
6. Limitations
The methodology is a composition rule, and a composition rule is only as honest as the inputs it composes. We name the specific things this paper cannot conclude.
The vendor prices are list prices, not negotiated rates. Retell at $0.31, the Vapi-style $0.243 decomposition, and the Stack D $0.50 floor are the rates a buyer would pay through self-service or as a published floor; enterprise procurement routinely produces 30–50% discounts at volume tiers above 100,000 monthly minutes, and we did not have access to negotiated quotes. The rank order in Table 2 may shift under realistic enterprise pricing.
Stack D's per-minute price is the lowest-confidence input in the worked example. Enterprise voice-AI pricing is genuinely opaque: floor pricing, professional-services bundles, committed-spend discounts, and platform fees combine into a per-minute equivalent that the vendor rarely publishes. Our $0.50/min is sourced from CloudTalk's published voice-AI rate [16] and corroborated by Retell's vendor comparison upper bound [14], but a buyer signing a Stack-D-class contract will negotiate against the vendor's actual quote, not against a published floor. The rank-flip we report at E ≥ $8.80 (Stack D beating Retell) is robust to ±15% perturbation on Stack D's per-minute rate, but a buyer should re-run §4.4's grid against the negotiated rate before drawing a procurement conclusion.
The containment values are benchmark proxies, not buyer-domain measurements. τ-Voice [19] reports task completion across grounded retail and airline tasks, which is closer to a pre-tuning baseline than to the post-tuning containment a real buyer experiences after three to six months of iteration. A buyer with a clean, well-scoped use case may exceed our inputs by 10 to 20 points; a buyer with multilingual, noisy, or PII-heavy traffic may sit below them. Stack D's 0.55 containment is the furthest from the τ-Voice anchor and is the input most exposed to vendor-claim bias; a procurement team should require the vendor to quote a containment commitment against a defined workload rather than accepting the floor figure on faith.
The escalation cost is a single-point disclosure. $7.40/call comes from one vendor's published comparison [8] and is calibrated to a specific call mix and a specific labour market. Belfiore's $8.00 [2] sits within 8% of it, which is some triangulation, but neither is a meta-analysis. A buyer in a market where loaded customer-service labour is half or twice the disclosed range would compute different cost-per-resolution numbers, and the rank order in Table 2 is sensitive to this. The §4.4 grid covers the realistic range $5–$15.
Stack C's per-minute price is a back-of-the-envelope composition. Self-hosted variable cost depends on Deepgram's volume tier, on whether ElevenLabs Flash is committed monthly or paid as you go, on Twilio's regional rate, and on Claude Haiku's input/output token mix per call. We composed plausible mid-tier rates; a careful buyer would replace our $0.105 with their own quote-driven figure before drawing a procurement conclusion.
The multi-variable grid in §4.4 is a 5×4 sample of a continuous surface. A finer grid or a contour plot would reveal the cross-over thresholds more precisely; we report the analytic crossover thresholds in §4.4 as the operative numbers and treat the discrete grid as an illustration of the rank-stability across buyer-domain contexts. The grid does not vary handle time or per-minute price, both of which would shift the cross-overs.
The formula does not credit upstream deflection. Calls deflected by IVR or self-service before reaching the voice agent never enter the denominator. A stack that integrates well with the buyer's existing IVR may show a worse cost-per-resolution while reducing total operating cost. The metric is a within-voice-agent comparison, not a contact-centre P&L.
Containment is a single-call definition. We used containment as the ratio of calls the AI resolved without escalation on a single call. PolyAI [11] notes this can mask repeat-caller patterns where the same issue surfaces again within seven days. A net-of-repeat containment would lower every value in Table 1; we did not model it.
Resolution is not weighted by quality. A resolution that produces a low CSAT is counted as a resolution. The literature on quality-weighted resolution metrics [4, 7] supports a downstream adjustment, and a buyer with a hard CSAT floor would want to apply one.
The worked example is four stacks. Four stacks span the public market shape (fully managed, decomposed-managed, self-hosted, enterprise floor) but are not exhaustive. An in-house build at a major bank, a vertical-specialist vendor in healthcare, or a cost-leading offshore BPO with AI-augmented agents would each shift the picture; we did not have public price disclosures for those.
7. Conclusion
We defined a closed-form cost-per-resolution formula for voice agents, applied it to four real public stacks at baseline inputs drawn from vendor pricing pages and a public benchmark, and reported two rank-flips in which the per-minute and per-resolution orderings of those stacks disagreed. The cost-per-resolution figures ranged from $5.29 to $7.15; a 35% spread on stacks whose per-minute rates spanned 376%. A two-dimensional sensitivity grid showed the rank order is set by escalation cost, not by containment shift; the analytic cross-over thresholds (Stack D beats Retell at E ≥ $8.80, beats Vapi at E ≥ $6.34) reduce the four-stack comparison to a one-line decision rule against the buyer's own labour cost. Containment dominated the metric and recovered the call-centre 1:1 rule between first-call-resolution gains and operating-cost reductions, and Appendix A shows the formula's escalation term reduces to the standard Erlang C staffing model from the operations-management literature. The composition rule is the contribution. Procurement teams who score voice-agent vendors on the unit the vendors quote are optimising the wrong number; the formula in §3.1 gives them the unit they actually pay in.
Appendix A. Erlang C derivation of the escalation term
The escalation cost E in §3.1 is the per-call cost of human handling. We adopted $7.40 from a public vendor disclosure [8] and noted that Belfiore's $8.00 [2] sits within 8% of it. This appendix shows that the disclosed figure is consistent with the Erlang C staffing model used in workforce-management software [1, 26], grounding the formula's escalation arm in the operations-management lineage.
A.1 Erlang C staffing
In a contact centre staffed by humans, the Erlang C model gives the probability that an arriving call queues rather than being answered immediately, as a function of arrival rate λ (calls per hour), average handle time Th (hours per call), and number of agents N [1]. The staffing decision is the smallest N such that the queue probability falls below a target service-level threshold (typically P(wait > 20s) ≤ 0.20).
For a call centre running at occupancy ρ = λ · Th / N, the loaded labour cost per served call is
Cper_call = (Wloaded · Th) / ρ
where Wloaded is the loaded hourly wage of one agent (base salary plus benefits, supervision overhead, facilities, and tooling, typically 1.4–1.6× base [1]). Th is the average handle time including after-call work. Occupancy ρ rarely exceeds 0.85 in practice because higher occupancy degrades service level [26].
Worked example. At Wloaded = $52.50/hr (representative US loaded rate for inbound customer service, mid-2020s), Th = 4 minutes = 1/15 hr, and ρ = 0.85:
Cper_call = ($52.50 · (1/15)) / 0.85 = $3.50 / 0.85 = $4.12 per served call
A.2 Adding the follow-up factor
Belfiore [2] reports that unresolved calls produce on average 1.5 follow-up contacts in the resolution window. Each follow-up contact incurs the same Cper_call plus the customer-experience cost of the rework. Treating follow-ups as adding 1.5× the per-call cost; the conservative reading of Belfiore; the loaded cost of an escalated trajectory becomes
E = Cper_call · (1 + f) = $4.12 · 1.5 = $6.18
where f = 0.5 is the fractional follow-up multiplier on the initial human-handled call (0.5 because one initial call plus 0.5 in expected follow-ups equals the 1.5 contacts Belfiore documents). The $6.18 figure is approximately 17% below the $7.40 baseline disclosed by [8]. Adding 15–20% for cold-transfer penalty [10]; the cost of context loss when the call hands off from the AI to the human; closes the gap to the disclosed figure within rounding.
The disclosed $7.40 from [8] therefore corresponds to a loaded labour cost in the $50–60/hr range, occupancy near the standard 0.85 ceiling, and a follow-up factor in the Belfiore range. Each of these inputs is independently published, and the disclosed figure is consistent with all three.
A.3 The substitution credit
When an AI agent contains a fraction c of inbound calls, the human-side staffing requirement falls in proportion. With arrival rate λ total calls per hour, the human-side arrival rate becomes (1 − c) · λ, and the Erlang C staffing requirement scales approximately linearly with arrival rate at fixed service level, so the human-side staffing cost per inbound call falls from Cper_call to (1 − c) · Cper_call. Including the follow-up factor, the per-inbound-call human-side cost is (1 − c) · E, which is exactly the second term of the formula in §3.1.
The first term (p · T) / c is the AI-side cost loaded onto each resolved call: the buyer pays for p · T in agent-minutes per inbound call, and the buyer's resolutions are c per inbound call, so each resolution carries (p · T) / c of agent-minute spend.
Adding the two terms gives the per-resolution cost of one inbound call processed end-to-end: AI-side spend per resolution plus the expected human-side cost per inbound call. This is the formula. Its escalation arm is not an ad-hoc proxy but a reduction of the Erlang C staffing cost under proportional substitution, which is the linearity assumption the SWPP reference [26] documents and Akşin et al. [1] survey.
A.4 Where the linearity assumption breaks
Two regimes are worth flagging. First, Erlang C staffing is non-linear near the service-level threshold: a small drop in arrival rate may not reduce required staffing by the same proportion, because the threshold operates on the integer number of agents. At small contact centres (fewer than ~30 agents), the substitution credit is over-stated by the proportional rule; the real saving is stepwise. Second, the linearity assumption requires that the AI-contained calls and the human-handled calls have similar handle-time distributions. If the AI contains predominantly easy calls (short handle time) and escalates predominantly hard calls (long handle time); a common pattern, since AI agents struggle on the hard tail; then the human-side handle time on escalated calls is longer than the average Th, and the per-inbound-call human-side cost is higher than (1 − c) · E. A procurement team in a domain where the AI's contained-call handle time is clearly shorter than the operation's overall average should treat E as a lower bound and consider an explicit handle-time multiplier on escalations. The §6 limitation on quality-adjusted resolution captures the same concern from a different angle.
References
- [1]Akşin, Z., Armony, M., Mehrotra, V. (2007). The Modern Call Center: A Multi-Disciplinary Perspective on Operations Management Research. Production and Operations Management 16(6): 665–688. http://www.columbia.edu/~ww2040/4615S13/AAM07.pdf (accessed 2026-05-04) · doi:10.1111/j.1937-5956.2007.tb00288.x
- [2]Belfiore, B. (2014). Contact Center Economics 101: First Call Resolution; It's Not Only a Quality Metric. BenchmarkPortal. https://resources.benchmarkportal.com/contact-center-articles/contact-center-economics-101-first-call-resolution-its-not-only-a-quality-metric (accessed 2026-05-04)
- [3]Rumburg, J. (2021). The Metric of Cost Per Contact. ICMI / MetricNet. https://www.icmi.com/resources/2021/contact-center-metric-cost-per-contact (accessed 2026-05-04)
- [4]Cole, A. (2026). Contact Center Cost Per Resolution: The KPI Your Metrics Miss. CX Today. https://www.cxtoday.com/contact-center/are-your-contact-center-metrics-hiding-true-costs/ (accessed 2026-05-04)
- [5]Mehta, M. (2025). Outsourced Call Center Pricing Guide for 2026. Crescendo. https://www.crescendo.ai/blog/outsourced-call-center-pricing-guide (accessed 2026-05-04)
- [6]The Team at CallMiner (2019). Why First Call Resolution Matters and How to Improve FCR. CallMiner blog. https://callminer.com/blog/first-call-resolution-benefits (accessed 2026-05-04)
- [7]Şimşek, T. (2025). The True Cost of Customer Support: 2025 Analysis Across 50 Industries. LiveChatAI. https://livechatai.com/blog/customer-support-cost-benchmarks (accessed 2026-05-04)
- [8]Jonas, T. (2025). What AI Agents Actually Save: Real Contact Center ROI with Automation. Replicant blog. https://www.replicant.com/blog/contact-center-automation-roi (accessed 2026-05-04)
- [9]Replicant (2025). When to Hand Off to a Human: How to Set Effective AI Escalation Rules. Replicant blog. https://www.replicant.com/blog/when-to-hand-off-to-a-human-how-to-set-effective-ai-escalation-rules (accessed 2026-05-04)
- [10]Bucher + Suter (2026). Escalation Design: Why AI Fails at the Handoff (Not the Automation). Bucher + Suter blog. https://www.bucher-suter.com/escalation-design-why-ai-fails-at-the-handoff-not-the-automation/ (accessed 2026-05-04)
- [11]Haynes, T. (2024). 8 Metrics You Must Know to Evaluate the Impact of Call Center Voice AI. PolyAI blog. https://poly.ai/blog/8-metrics-you-must-know-to-evaluate-the-impact-of-call-center-voice-ai/ (accessed 2026-05-04)
- [12]Sharma, S. (2026). Voice Agent Evaluation Metrics: Definitions, Formulas & Benchmarks. Hamming AI Resources. https://hamming.ai/resources/voice-agent-evaluation-metrics-guide (accessed 2026-05-04)
- [13]Sharma, S. (2025). Best Voice Agent Stack: A Complete Selection Framework. Hamming AI Resources. https://hamming.ai/resources/best-voice-agent-stack (accessed 2026-05-04)
- [14]Retell AI (2025). Real-Time Pricing Showdown: What 10K Minutes Cost on Each Voice AI Platform. Retell AI Resources. https://www.retellai.com/resources/voice-ai-platform-pricing-comparison-2025 (accessed 2026-05-04)
- [15]Ahmed, J. (2026). AI Voice Agent Pricing Breakdown. jahanzaib.ai. https://www.jahanzaib.ai/blog/ai-voice-agent-pricing-breakdown (accessed 2026-05-04)
- [16]Lucido-Balestrieri, S. (2026). How Much Does Voice AI Cost?. CloudTalk blog. https://www.cloudtalk.io/blog/how-much-does-voice-ai-cost/ (accessed 2026-05-04)
- [17]Dograh AI (2026). Self-Hosted Voice Agents vs. Vapi: Real Cost Analysis and TCO Break-Even. Dograh blog. https://blog.dograh.com/self-hosted-voice-agents-vs-vapi-real-cost-analysis-tco-break-even/ (accessed 2026-05-04)
- [18]Yao, S., Shinn, N., Razavi, P., Narasimhan, K. (2024). τ-bench: A Benchmark for Tool-Agent-User Interaction in Real-World Domains. arXiv:2406.12045. https://arxiv.org/abs/2406.12045 (accessed 2026-05-04) · doi:10.48550/arXiv.2406.12045
- [19]Ray, S., Dhandhania, K., Barres, V., Narasimhan, K. (2026). τ-Voice: Benchmarking Full-Duplex Voice Agents on Real-World Domains. arXiv:2603.13686. https://arxiv.org/abs/2603.13686 (accessed 2026-05-04) · doi:10.48550/arXiv.2603.13686
- [20]Ethiraj, V., David, A., Menon, S., Vijay, D. (2025). Toward Low-Latency End-to-End Voice Agents for Telecommunications Using Streaming ASR, Quantized LLMs, and Real-Time TTS. arXiv:2508.04721. https://arxiv.org/abs/2508.04721 (accessed 2026-05-04) · doi:10.48550/arXiv.2508.04721
- [21]Pan, G., Chodnekar, V., Roy, A., Wang, H. (2025). A Cost-Benefit Analysis of On-Premise Large Language Model Deployment: Breaking Even with Commercial LLM Services. arXiv:2509.18101. https://arxiv.org/abs/2509.18101 (accessed 2026-05-04) · doi:10.48550/arXiv.2509.18101
- [22]Erdil, E. (2025). Inference Economics of Language Models. arXiv:2506.04645. https://arxiv.org/abs/2506.04645 (accessed 2026-05-04) · doi:10.48550/arXiv.2506.04645
- [23]Zhuang, B., Qiao, J., Liu, M., Yu, M., Hong, P., Li, R., Song, X., Xu, X., Chen, X., Ma, Y., Gao, Y. (2025). Beyond Benchmarks: The Economics of AI Inference. arXiv:2510.26136. https://arxiv.org/abs/2510.26136 (accessed 2026-05-04) · doi:10.48550/arXiv.2510.26136
- [24]Gao, N., Zhang, W., Dai, Y., Shi, L., Wang, Z., Wang, Y., He, W., Wang, J., Wang, C. (2026). Reinforcing Real-World Service Agents: Balancing Utility and Cost in Task-Oriented Dialogue. arXiv:2602.22697. https://arxiv.org/abs/2602.22697 (accessed 2026-05-04) · doi:10.48550/arXiv.2602.22697
- [25]Braggaar, A., Liebrecht, C., van Miltenburg, E., Krahmer, E. (2023). Evaluating Task-Oriented Dialogue Systems: A Systematic Review of Measures, Constructs and Their Operationalisations. arXiv:2312.13871. https://arxiv.org/abs/2312.13871 (accessed 2026-05-04) · doi:10.48550/arXiv.2312.13871
- [26]Society of Workforce Planning Professionals (2024). Calculating Call Center Staff. SWPP Certification Resources. https://swpp.org/certification/articles/calculating-call-center-staff/ (accessed 2026-05-04)
Reproduce
- Data
papers/cost-per-resolution-methodology/ - Scripts
papers/cost-per-resolution-methodology/